Hi @pkr2,
First of all, there are many ways to do it, and here are my answers. 
Question: So this is only for One Graph If I want to show more than one?
Answer: If you are creating a different graph with a different GSQL query then I would create a different new object of the graph with the new API call. Make sure the different objects (like graph and container_id) has to be unique.
The code snippet is my example to create a separated graph. App.js
import ‘./App.css’;
import React, { Component } from ‘react’;
import axios from ‘axios’;
import G6 from ‘@antv/g6’;
import { Navbar, Container, Nav } from ‘react-bootstrap’;
import ‘bootstrap/dist/css/bootstrap.min.css’;
class App extends Component {
constructor() {
super();
this.state = { data: [] };
}
componentDidMount() {
axios
.get(‘http://127.0.0.1:8000/listPatients_Infected_By’)
.then((res) => {
if (res.status === 200) {
this.setState({ data: res.data });
const container = document.getElementById(‘container’);
const width = container.scrollWidth || 1280;
const height = window.height || 800;
const graph = new G6.TreeGraph({
container: ‘container’,
width,
height,
linkCenter: true,
modes: {
default: [
{
type: ‘collapse-expand’,
onChange: function onChange(item, collapsed) {
const data = item.get(‘model’);
data.collapsed = collapsed;
return true;
},
},
‘drag-canvas’,
‘zoom-canvas’,
‘drag-node’,
‘activate-relations’,
],
},
defaultNode: {
size: 55,
},
layout: {
type: ‘dendrogram’,
direction: ‘RL’,
nodeSep: 20,
rankSep: 400,
radial: true,
},
});
graph.node(function (node) {
return {
label: ${node.name.slice(0, 3)}\n${node.name.slice(3)},
size: node.children.length ? 52 : 50,
};
});
          graph.edge(function (node) {
            return {
              label: `${node.id}`,
            };
          });

          graph.data(this.state.data);

          graph.render();
          graph.fitView();
          graph.get('canvas').set('localRefresh', false);
          graph.on('node:click', (evt) => {
            const nodeItem = evt.item;
            if (!nodeItem) return;
            const item = nodeItem.getModel();
            if (item.url) {
              window.open(item.url);
            }
          });
          if (typeof window !== 'undefined')
            window.onresize = () => {
              if (!graph || graph.get('destroyed')) return;
              if (
                !container ||
                !container.scrollWidth ||
                !container.scrollHeight
              )
                return;
              graph.changeSize(container.scrollWidth, container.scrollHeight);
            };
        }
      })
      .catch((err) => {
        console.error(err);
      });

    axios
      .get('http://127.0.0.1:8000/listPatients_Infected_By')
      .then((res) => {
        if (res.status === 200) {
          this.setState({ data: res.data });
          const container2 = document.getElementById('container2');
          const width = container2.scrollWidth || 1280;
          const height = window.height || 800;
          const graph2 = new G6.TreeGraph({
            container: 'container2',
            width,
            height,
            linkCenter: true,
            modes: {
              default: [
                {
                  type: 'collapse-expand',
                  onChange: function onChange(item, collapsed) {
                    const data = item.get('model');
                    data.collapsed = collapsed;
                    return true;
                  },
                },
                'drag-canvas',
                'zoom-canvas',
                'drag-node',
                'activate-relations',
              ],
            },
            defaultNode: {
              size: 55,
            },
            layout: {
              type: 'dendrogram',
              direction: 'RL',
              nodeSep: 20,
              rankSep: 400,
              radial: true,
            },
          });
          graph2.node(function (node) {
            return {
              label: `${node.name.slice(0, 3)}\n${node.name.slice(3)}`,
              size: node.children.length ? 52 : 50,
            };
          });

          graph2.edge(function (node) {
            return {
              label: `${node.id}`,
            };
          });

          graph2.data(this.state.data);

          graph2.render();
          graph2.fitView();
          graph2.get('canvas').set('localRefresh', false);
          graph2.on('node:click', (evt) => {
            const nodeItem = evt.item;
            if (!nodeItem) return;
            const item = nodeItem.getModel();
            if (item.url) {
              window.open(item.url);
            }
          });
          if (typeof window !== 'undefined')
            window.onresize = () => {
              if (!graph2 || graph2.get('destroyed')) return;
              if (
                !container2 ||
                !container2.scrollWidth ||
                !container2.scrollHeight
              )
                return;
              graph2.changeSize(
                container2.scrollWidth,
                container2.scrollHeight
              );
            };
        }
      })
      .catch((err) => {
        console.error(err);
      });
  }
  render() {
    return (
      <div className="App">
        <>
          <Navbar style={{ backgroundColor: '#F78117', marginBottom: 24 }}>
            <Container>
              <Navbar.Brand href="#home">TigerGraph</Navbar.Brand>
              <Nav className="me-auto">
                <Nav.Link href="https://www.tigergraph.com/">
                  Learn more
                </Nav.Link>
              </Nav>
            </Container>
          </Navbar>
        </>
        <div style={{ border: '4mm ridge #e3e3e3', margin: 50 }}>
          <h1>GSQL Query: listPatients_Infected_By(2000000205)</h1>
          <div id="container"></div>
          <div id="container2"></div>
        </div>
      </div>
    );
  }
}

export default App;
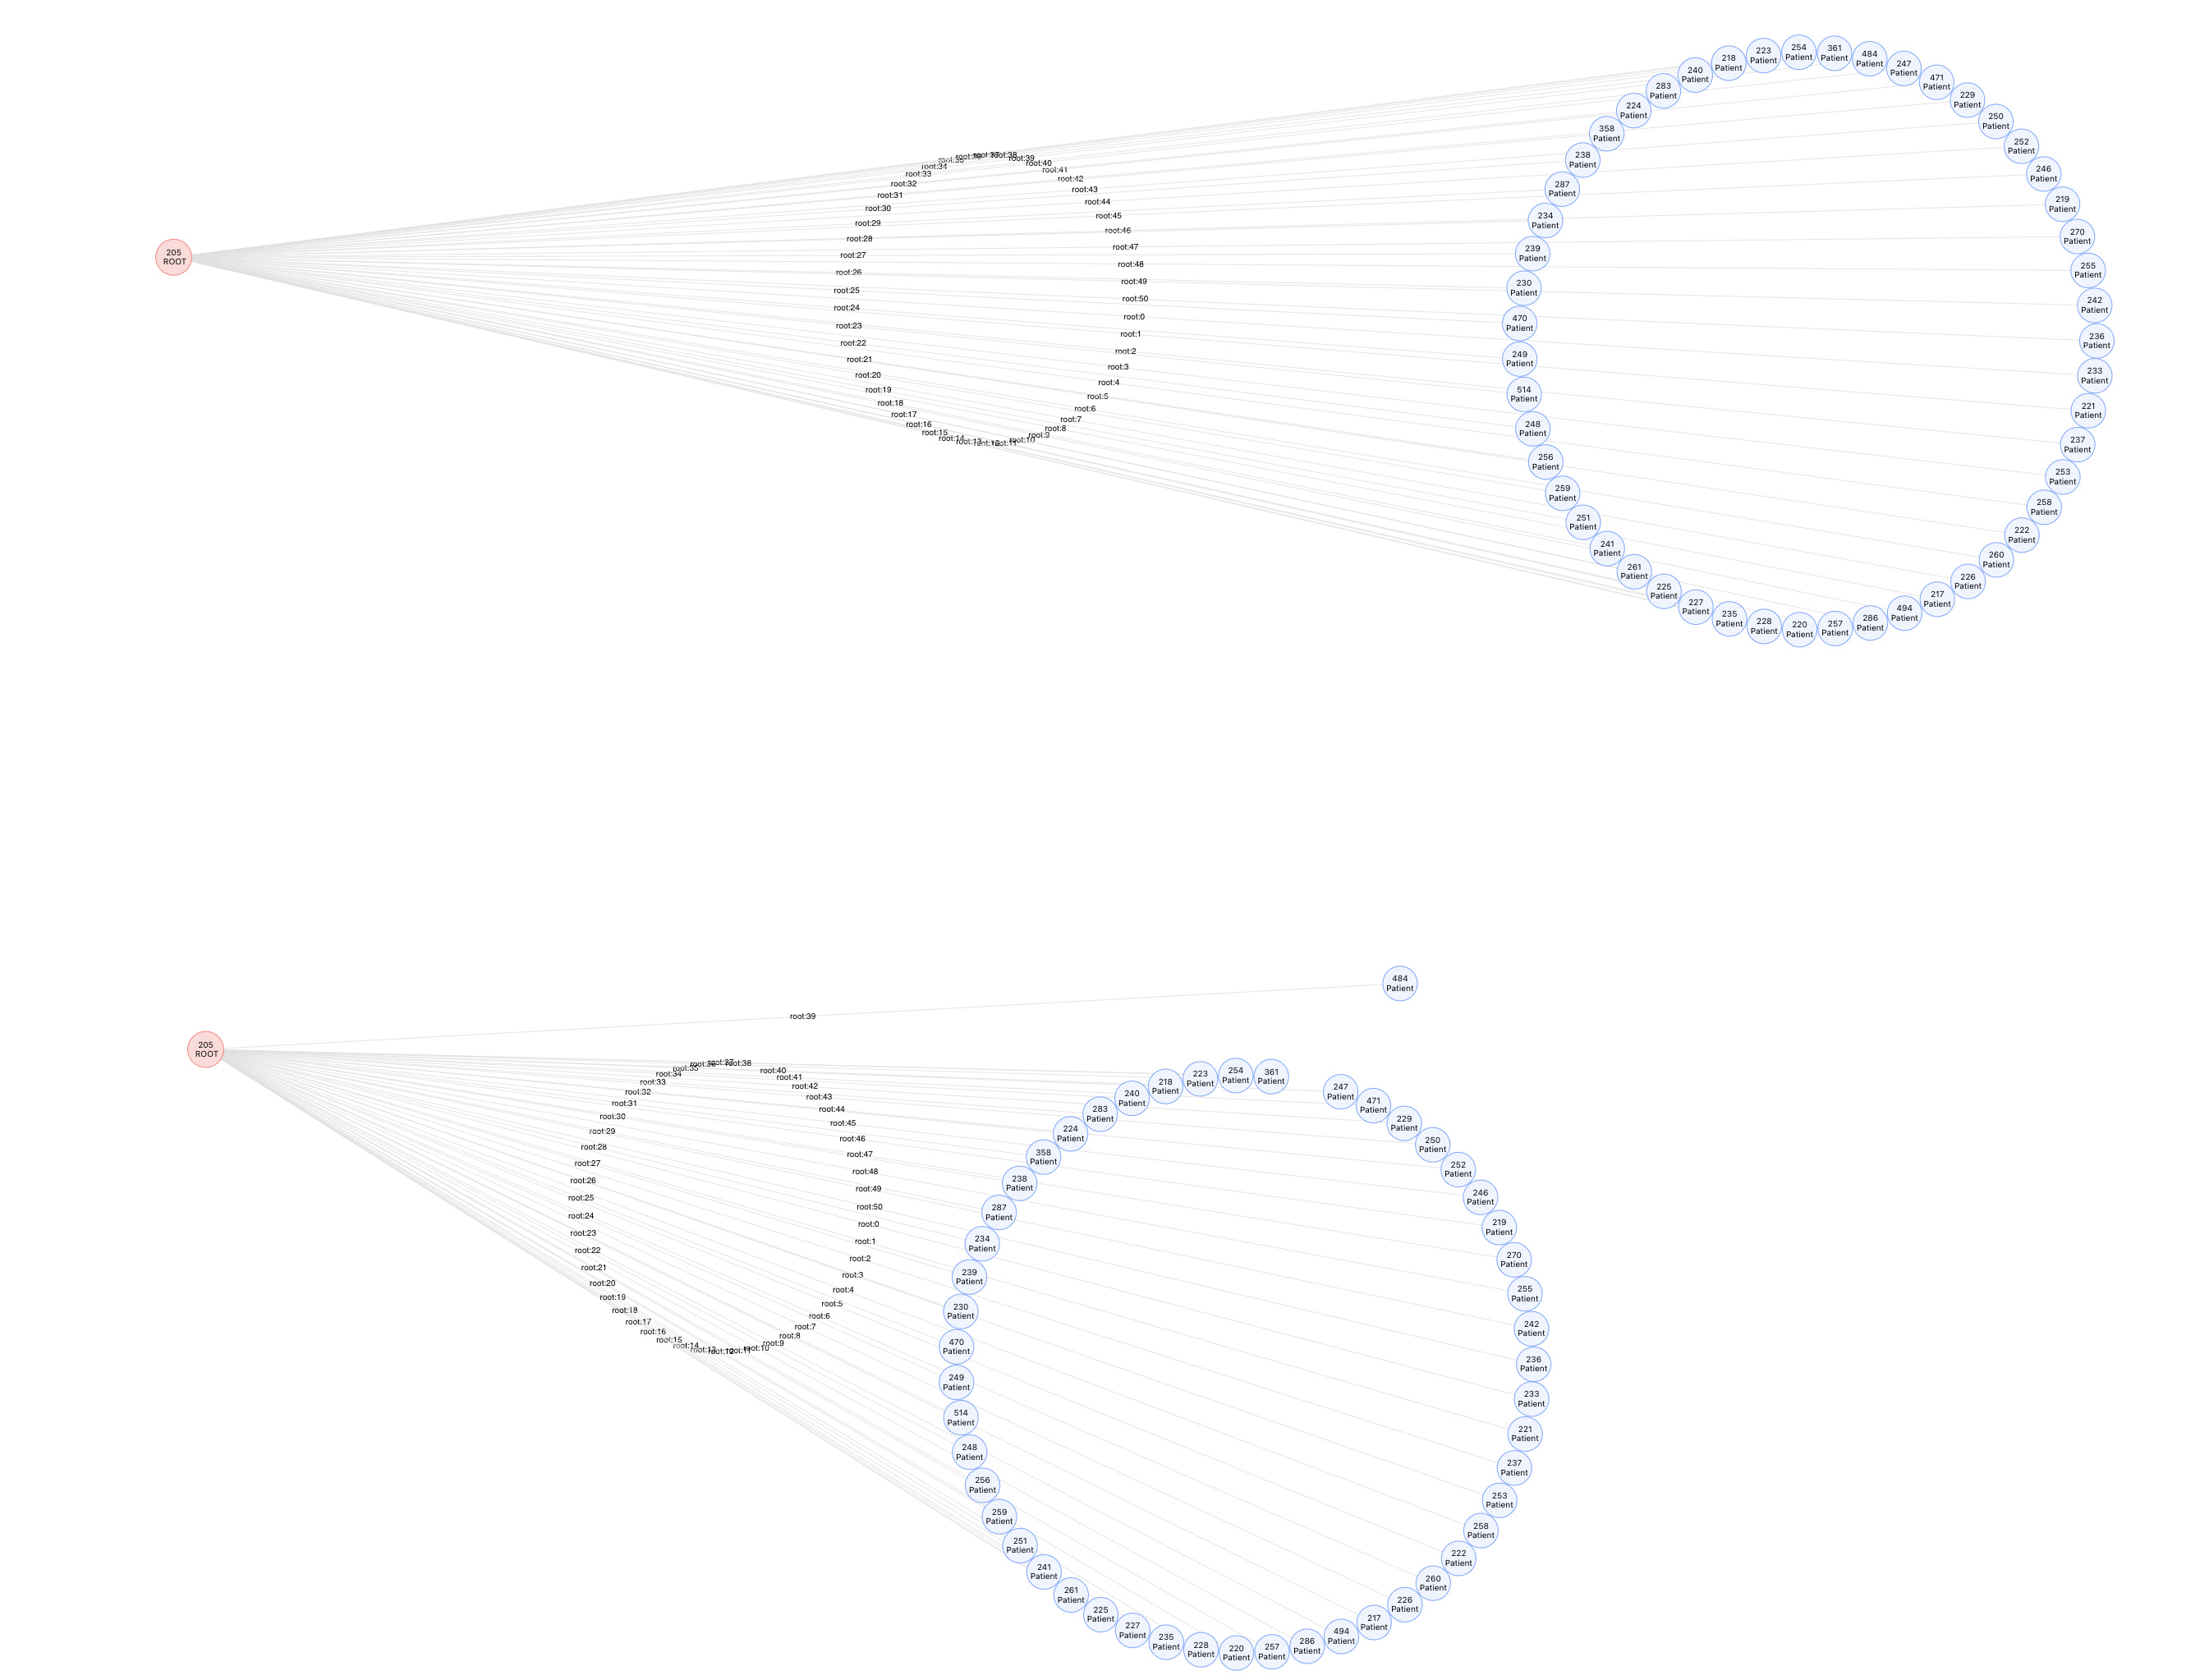
Result
If you want to create a subgraph and put together all the Vertices. I would configure the GSQL query output to have nested parent/child format, then the frontend code should does the TreeGraph for you.
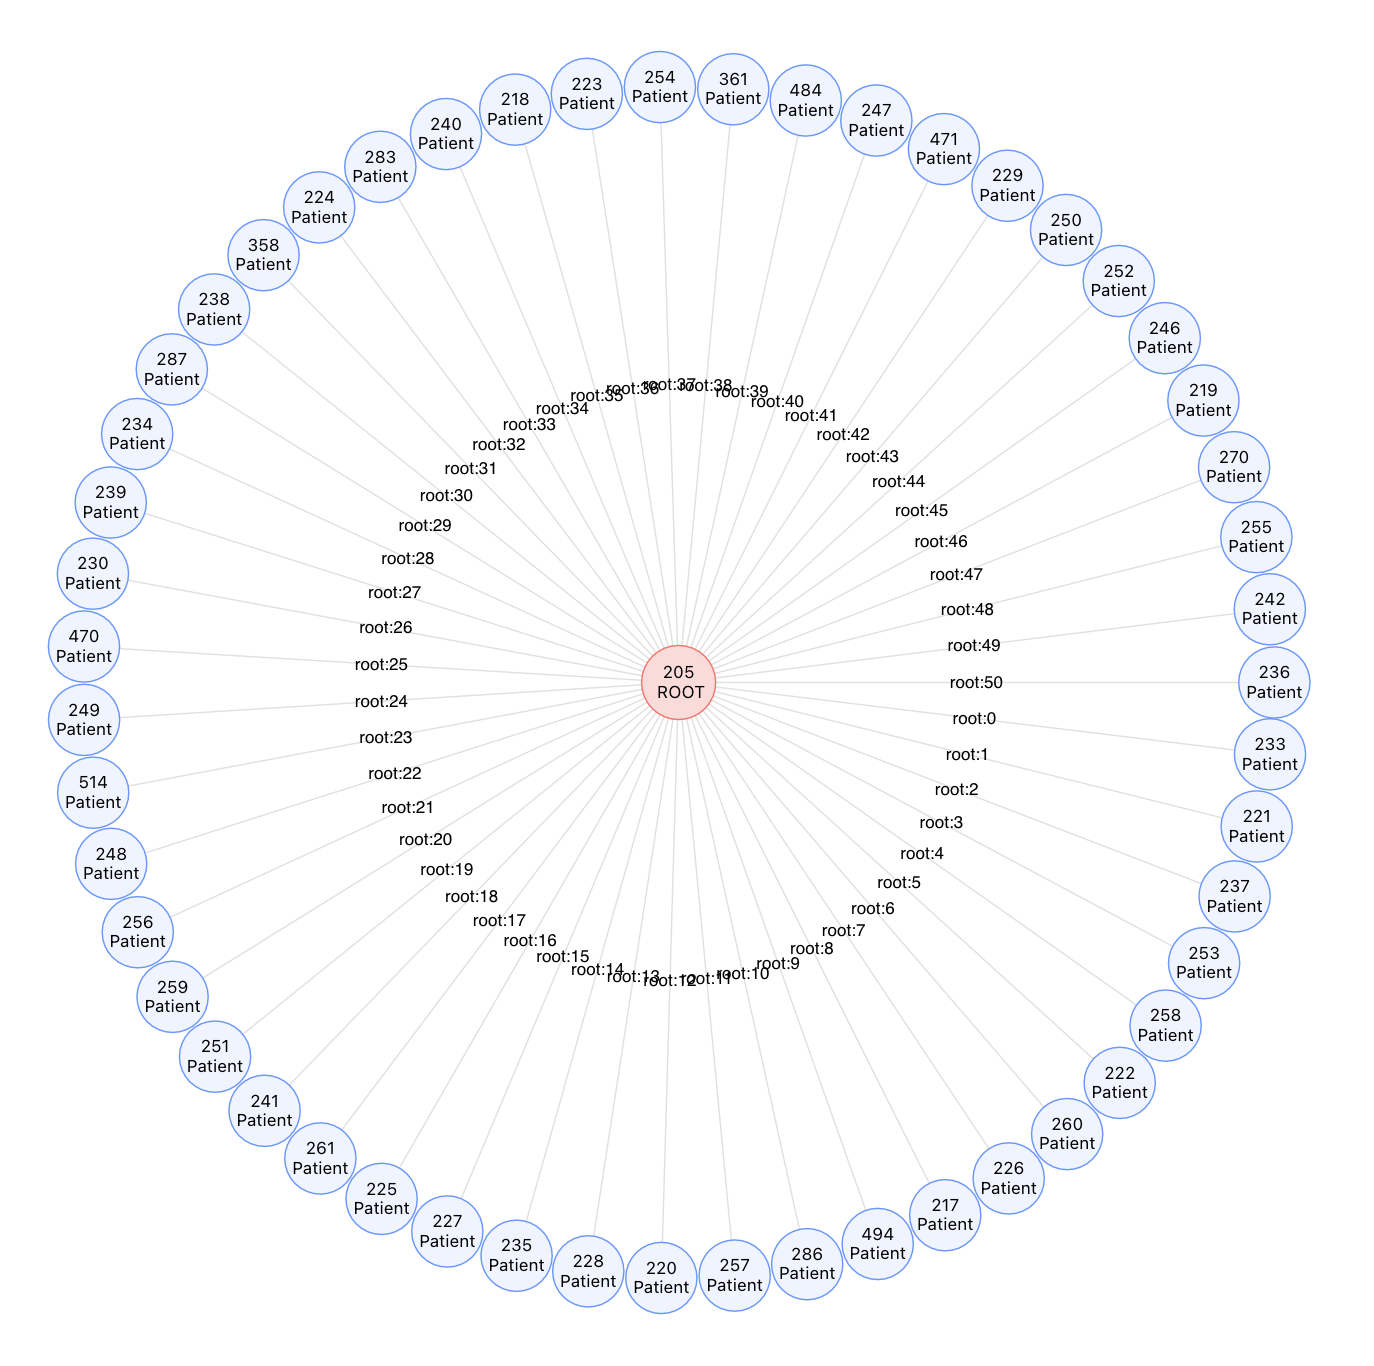
Question: and what about edge score? If I want to show edges score or something like edge attributes then what should I do?
Answer: Reference to the AntV G6 API Documentation Configure with graph.edge(edgeFn). I would store the edge score in another state data then pass the data using the edge function to assign the score values. You could also custom the edge style as well!
The code snippet is my example to assign edge values between vertices. App.js
graph.edge(function (node) {
            return {
              label: `${node.id}`,
            };
});
Result
Here are useful references to custom graph UI:
- Examples: https://g6.antv.vision/en/examples/gallery
- AntV G6 API: https://g6.antv.vision/en/docs/api/Graph