Can someone let me know how to get CPU usage & memory usage logs in linux server for the Tiger graph query & Jobs.
Hi @atulparihar,
Two great information before diving right into the TigerGraph Logs.
Troubleshoot on slow query performance then you can monitor the memory usage of specific queries through the GPE logs.
Regarding the CPU usage and more…
You could also check out the blog regarding Elasticsearch, Kibana, and Filebeat setup with TigerGraph to create explore the logs with visualization.
You can directly skip all the steps and begin from the " Let’s try the Docker Containers to automate all the steps."
Thanks for the valuable information.
I am planning to use this logs on splunk dashboard to visualise information
Is there any blogs/documentation also available for the same ?
Hi @atulparihar,
I haven’t created one, but the idea is about like this below.
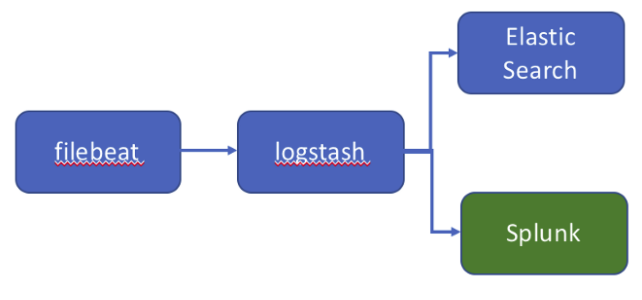
You can use this blog and this blog to create TigerGraph with the Splunk dashboard.
TigerGraph 3.2 gadmin command outputs a Filebeat configuration file filebeat.yml.