QPS, Timeout, Latency query metrics not showing in Tigergraph Admin portal
I am running a load test for Tiger graph queries and wanted to analyze the query throughput through the admin portal monitor dashboard. But the graph always shows no data in both current query performance and historic query performance view. Attaching images for reference.
Please provide suggestions
@arjun.krishnamurthy The Admin Dashboard contains 5 minutes of data in the picture (I believe) Can you try calling this endpoint to grab the QPS? I want to make sure it’s returning the value.
https://docs.tigergraph.com/tigergraph-server/current/api/built-in-endpoints#_show_query_performance
@Jon_Herke Thanks for your reply. Endpoint returns query statistics data for last 60 seconds which contains metrics for CompletedRequests, QPS, AverageLatency, MaxLatency, MinLatency. But still the dashboard in the admin portal shows no information in the graph. “Show query performance” endpoint accepts a parameter seconds which should be a positive integer less than 60 seconds. Is there any way to fetch query statistics for last 1 hour?
@arjun.krishnamurthy An alternative is to use the monitor_system_metrics endpoint. You can specify exact times and what you’re metrics you would like to pull. In you’re case you can set the what parameter to QPS.
Monitor system metrics
GET /ts3/api/datapoints
TigerGraph System State Service (TS3) is TigerGraph’s managed monitoring service that collects system metrics and events. Many TigerGraph components report metrics such as CPU usage, memory usage, disk usage, and network traffic to TS3 at regular intervals. This endpoint listens on port 14240 instead of port 9000.
You can use this endpoint to read from TS3. You can filter for the data points you need as follows:
- time:
when, from, and to
- component:
who
- metric:
what
- location:
where
Visualization of such metrics are available in Admin Portal - Dashboard - Cluster Monitoring.
On a TigerGraph cluster, this endpoint is only present on the m1 node.
Parameters
| Name |
Required |
Description |
from |
No |
Epoch timestamp that indicates the start of the time filter. Only data points reported after the timestamp will be included in the return results. |
to |
No |
Epoch timestamp that indicates the end of the time filter. Only data points reported before the timestamp will be included in the return results. |
latest |
No |
Number of latest data points to return. If provided, the endpoint will return the latest data points that satisfy the what, who and where filters and ignore other time-related filters. |
what |
No |
Name of the metric to filter for. Possible values are: |
-
cpu: Percentage of CPU usage by component
-
mem: Memory usage in megabytes by component
-
diskspace: Disk usage in megabytes by directory
-
network: Network traffic in bytes since the service started
-
qps: Number of requests per second by endpoint
-
servicestate: The state of the service, either online 1 or offline 0
-
connection: Number of open TCP connections
|who|No|Name of the component that reported the datapoint|
|where|No|Name of the node that the datapoint is reported for|
Hi @Jon_Herke ,
Thanks for your reply. Unfortunately both the API’s and Dashboard doesn’t help me here.
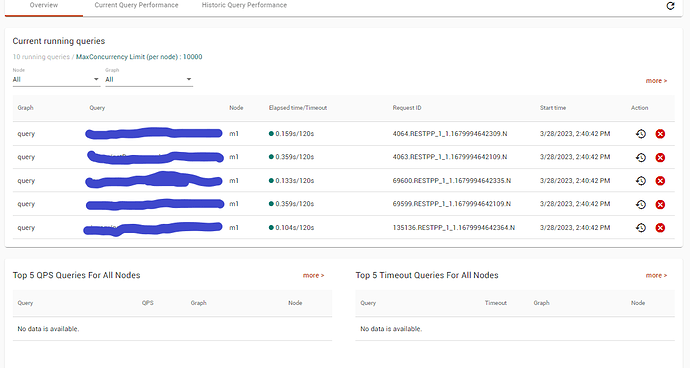
Monitor system metrics API returns empty data for QPS or latency metrics. Dashboard shows there are current running queries in Overview and Current Query Performance tab. But shows empty graph under Historic Query Performance tab. Please see the screenshot below
Thanks
@Jon_Herke No data shows up for Top 5 QPS queries, Top 5 timeout queries and Top 5 latency queries for all nodes. I am running an installed query through API here. Hope that shouldn’t make any difference in capturing the historic performance metrics. Tigergraph version is 3.9.0.

