
Is it possible to easily discover the current size of a TigerGraph database given the amount of data currently in it? I need to discover this to understand whether my data is less than the 50GB limit for using the free version of TigerGraph. Thank you.
@matthew.erler There are a few ways:
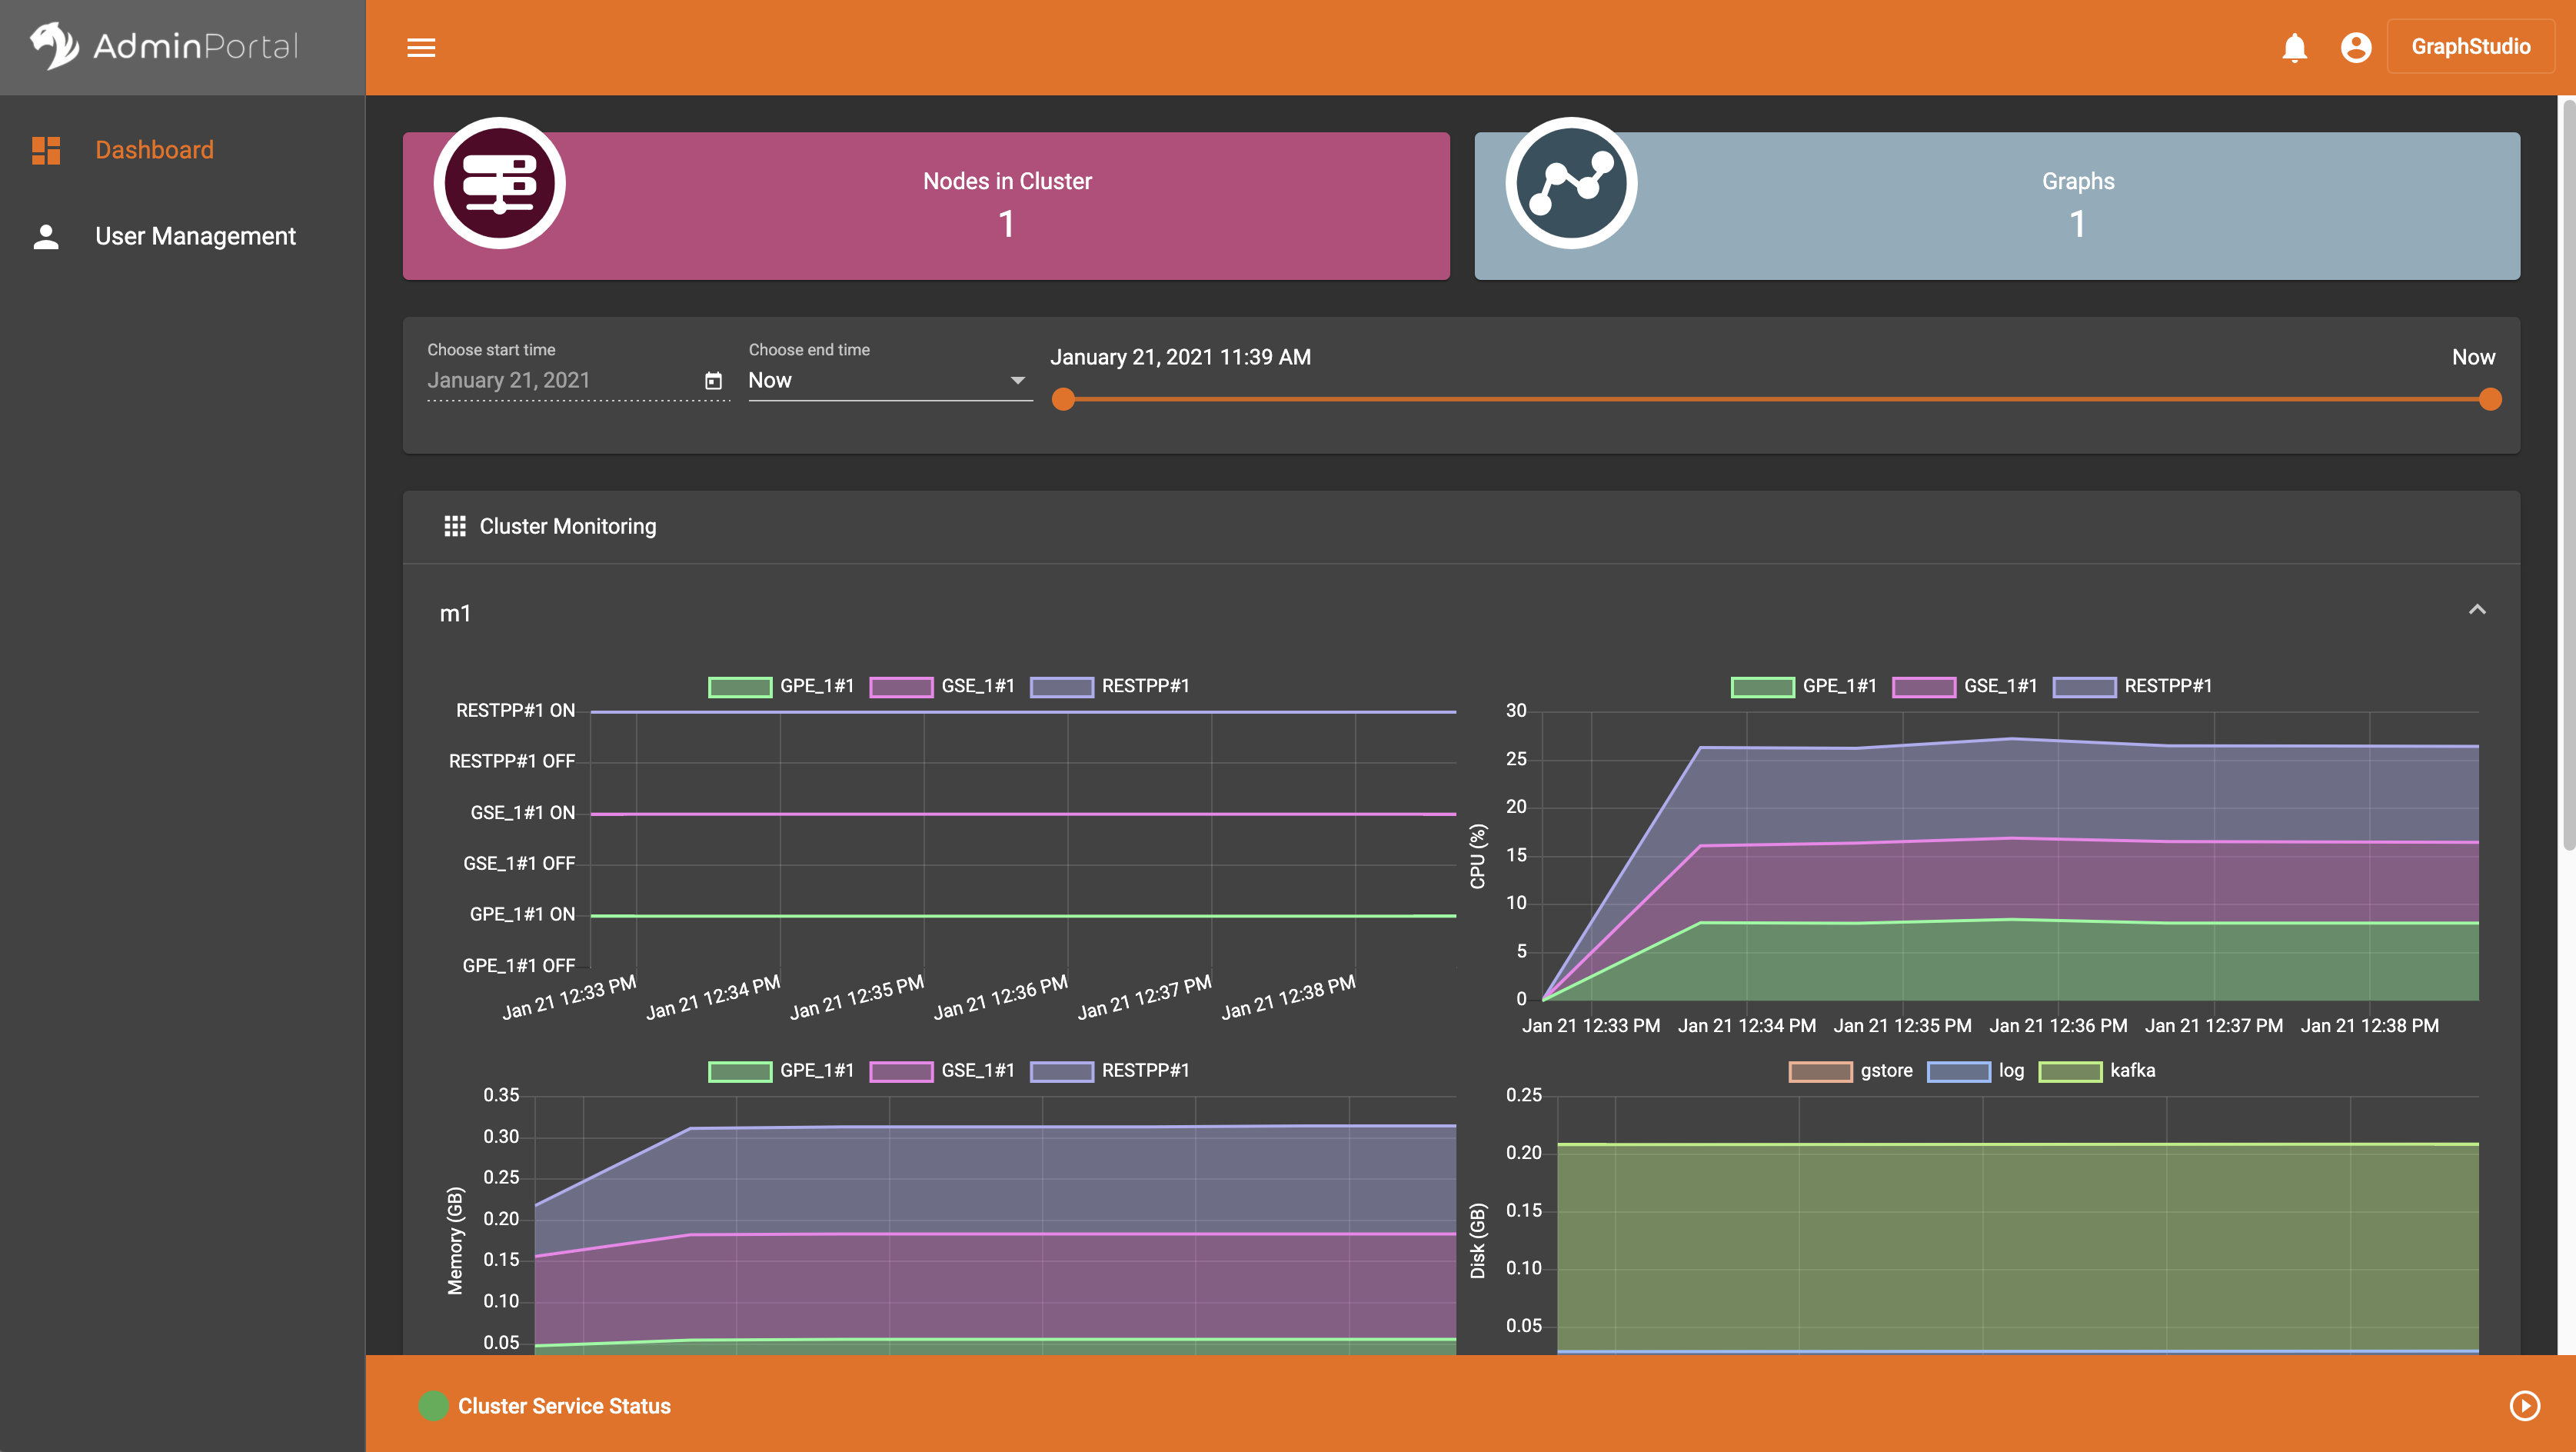
Using GraphStudio
- Click on top right “Admin” button
- Look at the memory consumption chart
Using a terminal
You can get statistics of Graph data on TigerGraph database instance using gstatusgraph utility:
Syntax:

gstatusgraph [-s <node_name>]

using -s to do statistics for one node
$ gstatusgraph
=== graph ===
[GRAPH  ] Graph was loaded (/data/tigergraph/tigergraph3/data/gstore/0/part/):
[m1     ] Partition size: 43GiB, IDS size: 16GiB, Vertex count: 262053633, Edge count: 1115267545, NumOfDeletedVertices: 130988916 NumOfSkippedVertices: 0
[m2     ] Partition size: 40GiB, IDS size: 16GiB, Vertex count: 261996922, Edge count: 971304656, NumOfDeletedVertices: 130998461 NumOfSkippedVertices: 0
[m3     ] Partition size: 44GiB, IDS size: 16GiB, Vertex count: 271436710, Edge count: 1115214212, NumOfDeletedVertices: 121605839 NumOfSkippedVertices: 0
[m4     ] Partition size: 44GiB, IDS size: 16GiB, Vertex count: 262030593, Edge count: 1191498785, NumOfDeletedVertices: 130964790 NumOfSkippedVertices: 0
[WARN   ] Above vertex and edge counts are for internal use which show approximate topology size of the local graph partition. Use DML to get the correct graph topology information
1 Like
Hi Jon,
I’m trying to project future needs in terms of RAM and disk storage.
I appears that RestAPP RAM usage stays fairly consistent no matter how large the database gets. GPE_1#1 seems to grow at the same rate as the database which means most of the actual data is stored here. However, GSE_1#1 seems to grow at half the rate of GPE. I assume that Indexes and other meta data is stored here. So would it be safe to say that if my current RAM usage is GPE + GSE for x amount of vertices and y amount of edges, then if I have 10x the amount of vertices and edges I just multiply GPE + GSE by 10 to get my rough future RAM needs? Is there a more accurate way to project this?
With respect to gstatusgraph, what does Partition size and IDS size mean? Does this refer to the memory taken up on disk? Also do we add both to get a total size of the database? And how does the gstore size in GraphStudio relate to these numbers?
Thx for your help.
Alvin
So would it be safe to say that if my current RAM usage is GPE + GSE for x amount of vertices and y amount of edges, then if I have 10x the amount of vertices and edges I just multiply GPE + GSE by 10 to get my rough future RAM needs? YES
With respect to gstatusgraph, what does Partition size and IDS size mean?
Partition Size is the the size of GPE excluding runtime RAM usage such as queries and graph updates. IDS is GSE, the ID service.
Does this refer to the memory taken up on disk?
It is relevant but not equivalent, for on disk size please check the folder size of tigergraph folder.
Also do we add both to get a total size of the database?
Yes partition + IDS is your graph data size
And how does the gstore size in GraphStudio relate to these numbers?
gstore doubles the partition size + IDS, it store partition twice to prevent corruption.
2 Likes
Thx Xinyu for the prompt reply! This helps a lot.
Alvin
1 Like