
Hi I have been trying to implement the Geospatial analysis, so i have referred the documents and also did watch complete webinar on geospatial analysis, kindly provide more materials on the same , Thank you
Hi @Roshan,
You might find the Haversine formula helpful. It computes the distance between lat/lon pairs.
Here’s a query that does that:
CREATE QUERY Check_Distance(VERTEX <location> l1, VERTEX <location> l2) FOR GRAPH motionData RETURNS(FLOAT){
  FLOAT a, c, distance;
    FLOAT x, y, r;
    PRINT l1.Lat;
    PRINT l1.Lon;
    PRINT l2.Lat;
    PRINT l2.Lon;
    r = 6371; # Earth radius in KM
    x = To_Rad(l2.Lat - l1.Lat);
    PRINT x;
    y = To_Rad(l2.Lon - l1.Lon);
    PRINT y;
    a = sin(x/2)*sin(x/2)+cos(To_Rad(l1.Lat))*cos(To_Rad(l2.Lat))*sin(y/2)*sin(y/2);
    PRINT a;
    c = 2*atan2(sqrt(a), sqrt(1-a));
    PRINT c;
    distance = r*c;
    # To Feet
    distance = distance * 0.621371;

    PRINT distance;
    RETURN distance;
}
Hi liz_anaya i did watch the webinar using below mentioned link
-
Graph Gurus Episode 8: Location, Location, Location - YouTube . Where he has used ‘Geospatial search UI’
. How do I open the Geospatial search UI ??. I have read all the documentation regarding the Geospatial Analysis but I need more to refer and implement the same . kindly share some tigergraph websites links and videos regarding the Geospatial analysis.
Thank You
Roshan,
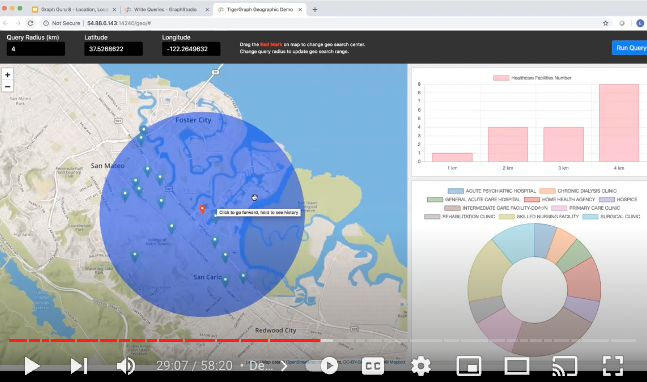
When you say, “Geospatial Search UI”, do you mean this?
This is not part of the TigerGraph product family. This is a sample dashboard that we built as a UI on top of the TigerGraph interface. Each of the 3 panels provides a visualization of the output of a graph query. Are you interested in knowing how to develop a dashboard UI like this?
Yes this s exactly what i want to learn so please help me with the building procedure. But before that i am facing difficulty in designing the schema itself . i have 2 csv data files , in which the 1st file i.e.(Demand File) has following ‘Major columns’
- Demand point index(which is basically index column values starts from 0 to 4095)
- X-Coordinate
3.Y-coordinate
2nd File has i.e. (Supply File) has following ‘Major columns’ - Supply point index(which is basically index column values starts from 0 to 99)
- X-Coordinate
3.Y-coordinate
So using which i have created 2 vertices(1 for demand , 1 for supply) and mapped the respective columns to csv file . Next how do i build a edge relationship between these two vertices ? please do guide me on this too
Thank you
@Roshan We host weekly community sessions to help with modeling (schema design), GSQL, open-source tools, etc. The next one is coming up on Tuesday at 9:30 am CST timezone on Discord. I’ve provided the link below. We could walk through your requirements above and provide some direct help/feedback. Would that work for you? (Event Link Below ![]() )
)

yes thank you , i’ll attend the sessions.
1 Like